



In this guide
Close to 70% of Australians with super in one of the major funds are invested in their fund’s MySuper option, the default option for employees who don’t wish to choose another super fund.
There are currently 54 MySuper products, down from 103 in 2018, and this trend is likely to continue as more mergers are finalised. According to SuperRatings insights manager Joshua Lowen, around 44% (24) of these 54 MySuper products have a lifecycle design. You can find a list of all MySuper Lifecycle funds at the end of this guide.
If you are a member of a retail fund MySuper default, this is most likely a lifecycle product designed to reduce your exposure to higher-risk growth assets as you age. A small but growing number of industry funds also use a lifecycle design, including Aware Super and Australian Retirement Trust (ART), but most use their traditional balanced or growth option as their MySuper default.
This makes it difficult to compare MySuper returns. Balanced or growth default options have a single strategy for all members with somewhere between 60% and 80% of members’ money in growth assets such as shares with the remainder in defensive assets such as cash and bonds. By comparison, lifecycle defaults might hold less than 40% or as much as 95% in growth assets, depending on your age and the fund’s design.
Why lifecycle funds?
Lifecycle super funds, sometimes called lifestage or target date funds, have been around since the early 1990s. While popular overseas, they didn’t really catch on in Australia until after the global financial crisis of 2007–09, which heightened investors’ awareness of market risk. Their position was further cemented with the introduction of MySuper in 2014, when many retail funds adopted a lifecycle approach as their MySuper default.
Lifecycle funds are based on the idea that investors in different age groups should not have the same mix (or allocation) of assets in their investment portfolio. While younger members can afford to accept a higher level of risk and hold more growth assets, it’s generally held that older members should take a more defensive approach as they get close to retirement.
They are also an acknowledgement that most super fund members are not actively engaged with their super and don’t know how it is invested. With this in mind, lifecycle products automatically increase the amount of defensive assets relative to growth assets as you age and your investment horizon draws nearer.
Automatic adjustments to your asset mix not only help reduce your exposure to market risk in the lead-up to retirement, or sequencing risk, but also reduce the temptation to tinker with your investments in reaction to adverse market movements.
Where are you on the road to retirement?

Retirement planning isn’t the same for everyone.
Take our 2-minute quiz to find out which stage you’re at and what you could focus on next.
The evolution of lifecycle funds
The first generation of lifecycle funds assumed members would access most, if not all, of their savings at retirement and could afford very little risk in the years leading up to that point. While most had young members starting off with 85% to 95% growth assets, de-risking started too early, mostly between age 40 and 45 and some even earlier.
Chant West research manager Mano Mohankumar says it was common for the growth/defensive asset mix to reduce to 50/50 as early as age 50 and 30/70 by age 65. This was despite the fact members can have 20 or more years’ life expectancy after they retire and would benefit from a meaningful allocation to growth assets to help preserve the value of their nest egg.
Mohankumar says another shortcoming of early lifecycle funds was abrupt changes in asset allocation, cutting growth assets by as much as 20 percentage points on a given day every five to 10 years. This resulted in arbitrary timing risks that affected some members but not others, especially in the period leading up to retirement.
The latest lifecycle funds offer a variety of approaches, but a common thread is that de-risking begins later, generally after age 50.
As Mohankumar points out, member account balances are driven by contributions until around age 45. It’s only after age 50 when balances are higher that investment returns become the dominant factor. So it is counterproductive to de-risk too early and limit members’ ability to grow their super balance.
Mohankumar says nowadays growth asset allocations average about 75% at age 55, 65% at age 60 and 53% at age 65. However, analysis by SuperGuide of a sample of 24 lifecycle funds found a wide dispersion of growth asset allocations.
As the graph below illustrates:
- From age 40 to your early 50s, growth asset allocations hold steady in a range of roughly 76% to 95%, a difference of 19 percentage points.
- De-risking is generally underway by age 55 when growth assets range from 56% to 88% and the gap widens to 32 percentage points.
- By age 60 the range of growth assets is 53% to 75%, while at 65 it is 42% to 62%.
- Some funds maintain growth assets above 60% from age 65 to age 80.
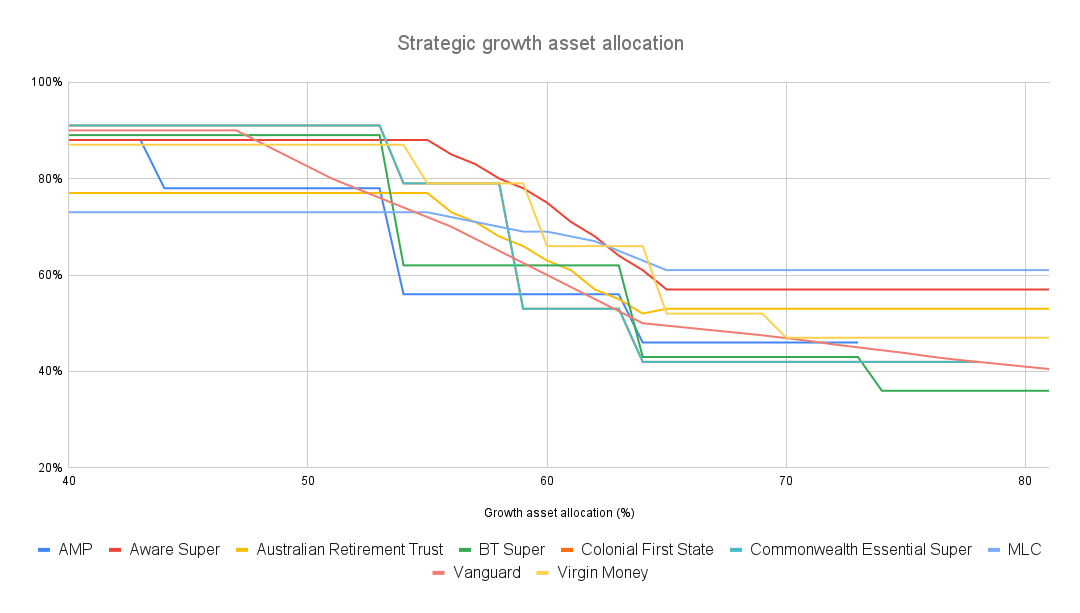
Source: SuperGuide, based on an original discussion on Reddit
You will also notice from the graph above that there are big differences in the ‘glidepath’ taken by different lifecycle funds.
Lifecycle fund examples
Lifecycle funds employ such a variety of approaches these days, a few examples will help illustrate some important differences. These are examples only and should not be taken as recommendations.
Vanguard
Vanguard introduced its default MySuper – Lifecycle fund in October 2022. As with all Vanguard funds, it uses passive, index-based portfolios.
The asset allocation within these investment portfolios is 90% growth assets and 10% defensive assets until age 47. From age 48 to 82 growth assets are reduced incrementally each year. From age 82 growth assets remain at 40%.
Aware Super
Aware Super’s FutureSaver MySuper Lifecycle default also uses three core investment options, but with higher levels of growth assets continuing well into retirement.
Members aged 55 and under are fully invested in the High Growth option with 88% growth assets. This is gradually dialled down so at age 60, for example, members are fully invested in the Balanced option with 75% growth assets. From age 65, members are fully invested in the Conservative Balanced option with 57% growth assets.
Russell Investments
Russell’s GoalTracker MySuper default initially uses your age and account balance to determine your asset mix. It then further personalises your investment by asking a set of questions, allowing you to set retirement income goals and track your progress.
Growth assets are set at 95% to age 50 then automatically decrease by 2.5% per year, giving a range of 82.5% to 92.5% between the ages of 51 and 55, and 70% to 80% from age 56 to 60. From age 60 growth assets are 70%.
Mercer
Mercer’s SmartPath puts members into five-year cohorts. It has one core investment portfolio but de-risks each age cohort within that portfolio.
For example, members born before 1954 have 60% growth assets, with growth assets gradually increasing to 90% for the 1969–73 cohort.
Top 10 MySuper lifecycle options for a 45-year-old (to 30 June 2026)
The table below shows the top 10 MySuper lifecycle options for a member aged 45, ranked by return over the 12 months to 30 June 2026. Because a lifecycle option holds a different asset mix at every age, returns can only be compared between funds at the same age.
| Super fund | Investment option | Growth assets (%) | 1 year return (%) | 10 year return (% per yr) |
|---|---|---|---|---|
| Colonial First State | FirstChoice MySuper – Lifestage 1980–84 | 93% | 13.6% | 9.4% |
| Essential Super | MySuper – Lifestage 1980–84 | 93% | 13.6% | 9.0% |
| Vanguard Super | MySuper – Lifecycle, age 47 and under | 90% | 12.3% | – |
| Team Super | MySuper – Lifecycle Investment Strategy, under age 50 | 93% | 12.1% | 9.4% |
| Virgin Money Super | LifeStage Tracker, born 1979–1983 | 90% | 11.9% | – |
| ANZ Smart Choice Super | MySuper 1980s | 87% | 11.3% | 8.6% |
| AMP SignatureSuper | MySuper 1980s | 86% | 11.2% | 8.9% |
| Mercer SmartPath | MySuper, born 1979–1983 | 88% | 10.4% | 9.1% |
| MLC MasterKey Business Super | MySuper, under age 55 | 75% | 9.9% | – |
| Australian Retirement Trust | QSuper Lifetime – Outlook | 85% | 9.4% | 7.2% |
Source: SuperRatings. Based on MySuper lifecycle options for a member aged 45. Returns are after investment fees and taxes and are rounded to one decimal place, but rankings are determined using unrounded data held by SuperRatings. A dash means a 10-year return is not available for that option.
The growth assets column shows how differently funds treat members of the same age. Among these 10 options, a 45-year-old’s growth allocation ranges from 75% to 93%, a difference of 18 percentage points. That spread is one reason the returns differ, although it doesn’t explain the order on its own.
Lifecycle options have benefited in recent years from the strong performance of share markets, because a lifecycle default holds more growth assets for younger members than a typical single-strategy MySuper option does. The same feature works in reverse when markets fall, so the chance of a negative year is higher too.
Lifecycle outcomes can shift across different market cycles and timeframes, so it’s worth looking at both the short- and long-term results.
While lifecycle options automatically adjust investment mixes based on your age, each product does so slightly differently and there are many other factors that can influence how you might want to invest. Even when you’ve chosen a lifecycle option, your super settings are still worth checking from time to time.
While it’s difficult to compare the performance of lifecycle and single strategy options, developments in recent years such as the ATO’s YourSuper comparison tool help fund members do just that. What’s more, members are encouraged to consider switching funds or investment options if their super underperforms, so there’s a lot at stake.
Lifecycle funds: What to look for
If you are a member of a lifecycle fund, or looking at investment options more generally, here are some things to keep in mind:
- Your investment horizon matters.
- A significant allocation to growth assets can still be appropriate for some people in their 60s and approaching retirement, depending on how long their savings need to last.
- The traditional approach of boosting defensive assets and reducing growth assets in the lead-up to retirement is not the only option, and it carries its own trade-offs.
- A higher allocation to growth assets spreads risk over a longer investment horizon, which is why younger members have historically had better outcomes from it. Over the long run, a single significant market fall has had less effect on their final balance.
- Once de-risking begins, a smooth reduction in growth assets reduces timing risks.
- There is no ‘correct’ asset mix. Different people require a different mix of growth and defensive assets depending on their investment horizon, account balance and tolerance for risk.
List of all MySuper Lifecycle funds
| Super fund | MySuper product name | Member accounts |
|---|---|---|
| Australian Retirement Trust* | Lifecycle Investment Strategy | 1,431,090 |
| Aware Super** | MySuper Lifecycle | 952,520 |
| Australian Retirement Trust (QSuper) | Lifetime | 522,440 |
| Mercer Super | Mercer SmartPath | 464,170 |
| MLC Super | MLC MySuper | 424,050 |
| AMP Super | AMP MySuper Lifestages | 362,090 |
| ANZ Smart Choice Super | MySuper | 309,770 |
| Colonial First State | FirstChoice Lifestage | 177,850 |
| Team Super*** | Lifecycle Investment Strategy | 129,920 |
| Essential Super | Lifestage | 121,450 |
| Guild Super | MySuper Lifestage | 94,220 |
| Active Super | Active Super Lifestage Product | 57,840 |
| Virgin Money Super | Lifestage Tracker | 49,720 |
| Russell Investments iQ Super | GoalTracker | 47,110 |
| smartMonday | smartMonday Lifecycle (MySuper) | 42,940 |
| Bendigo Super | Bendigo MySuper | 11,210 |
| Mercer Tailored Super | Mercer WGSP MySuper | 9,600 |
| Mercer Tailored Super | Mercer Tailored (CRG) MySuper | 8,740 |
| Vanguard Super | Lifecycle | 8,510 |
| SignatureSuper | Water Corp MySuper | 2,810 |
| SignatureSuper | AFLPA AFL MySuper | 2,340 |
| Santos Superannuation Plan | Mercer Santos MySuper | 1,340 |
Source: APRA, June 2024
*includes merged Qantas Super members
**includes merged TelstraSuper members
***includes merged TWUSUPER members
Get more guides like this with a free account
better super and retirement decisions.


Leave a Reply
You must be logged in to post a comment.