

In this guide
Greater choice of investments is one of the many reasons people decide to establish their own self-managed super fund (SMSF).
In the past, SMSFs have been criticised for being too heavily invested in cash and fixed income, and for having little diversity among their equity holdings. But this has changed over the past decade and SMSF trustees are increasingly adopting a diverse range of asset allocation strategies over a range of investments.
What are the most popular asset classes among SMSFs?
The Australian Taxation Office (ATO) publishes comprehensive data on asset allocation every financial year, based on the lodgings of SMSF annual returns. However, because of the lag between the end of the financial year and when trustees need to lodge, and the time it takes to collate the data, the latest annual figures are for the financial year ending in 2023.
The ATO also publishes quarterly estimates of asset allocation breakdown in the table below, sorted for the asset class with the highest allocation.
| Asset type | December 2024 $m | As a % of total Australian and overseas assets |
|---|---|---|
| Listed shares | 277,623 | 27.28% |
| Cash and term deposits | 161,442 | 15.86% |
| Unlisted trusts | 134,697 | 13.23% |
| Non-residential real property | 109,699 | 10.78% |
| Limited recourse borrowing arrangements | 72,022 | 7.08% |
| Listed trusts | 61,930 | 6.08% |
| Residential real property | 58,288 | 5.73% |
| Other managed investments | 57,079 | 5.61% |
| Borrowings | 27,194 | 2.67% |
| Other assets | 25,167 | 2.47% |
| Overseas shares | 18,650 | 1.83% |
| Unlisted shares | 13,922 | 1.37% |
| Debt securities | 11,717 | 1.15% |
| Other liabilities | 9,647 | 0.95% |
| Loans | 7,126 | 0.70% |
| Other overseas assets | 2,992 | 0.29% |
| Overseas managed investments | 2,350 | 0.23% |
| Cryptocurrency | 1,669 | 0.16% |
| Collectables and personal use assets | 683 | 0.07% |
| Overseas residential real property | 479 | 0.05% |
| Overseas non-residential real property | 207 | 0.02% |
| Insurance policy | 99 | 0.01% |
| Total Australian and overseas assets | 1,017,839 | 100.00% |
| Borrowings | 27,194 | 2.67% |
| Other liabilities | 9,647 | 0.95% |
| Total net Australian and overseas assets | 980,998 | 96.38% |
Source: ATO December 2024
Listed shares are the most popular asset class, representing 27.28% of all SMSF assets. That is followed by cash and term deposits at 15.86%, unlisted trusts at 13.23% and non-residential real property at 10.78%.
How does asset allocation vary depending on accumulation or retirement phase?
To provide a more up-to-date picture, SMSF administrator BGL analysed the asset distribution for the 2024 financial year of 181,242 SMSFs it has on its books that have lodged returns.
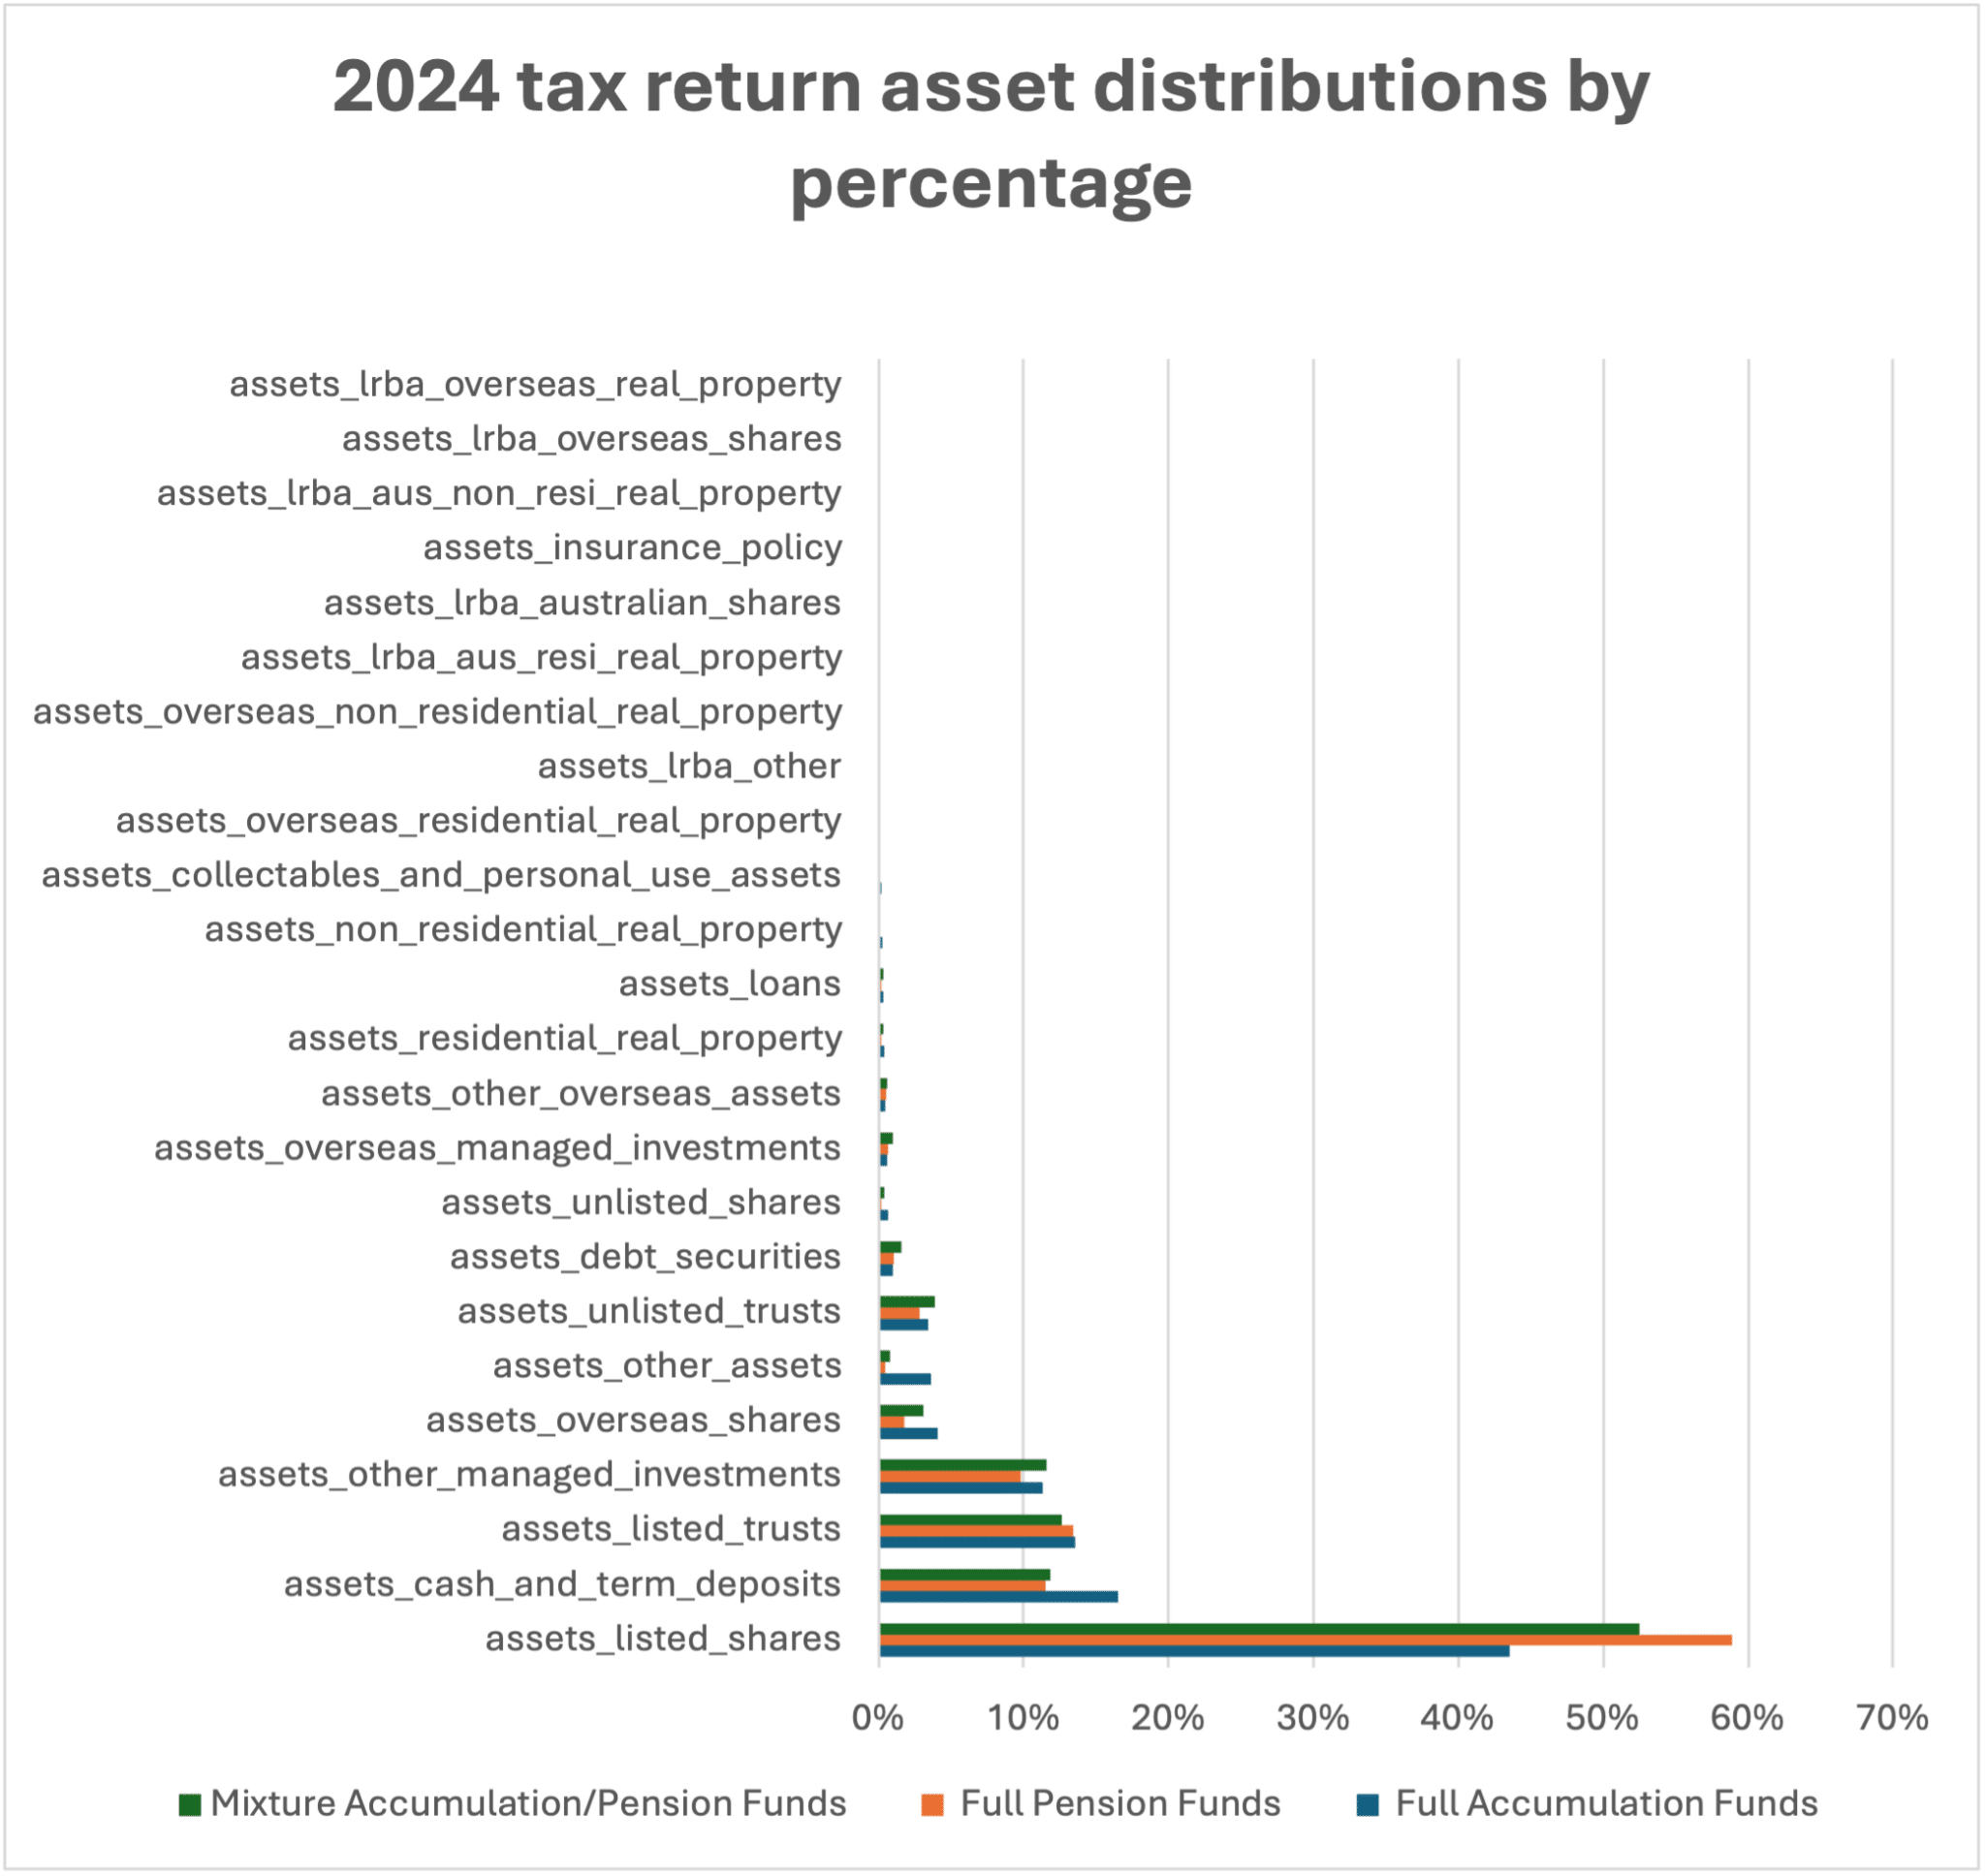
The following graph shows the asset class breakdown of SMSFs in accumulation phase, retirement phase and funds in both phases.
2022 tax return asset distributions by percentage
Source: BGL
Data extracted on 25/03/2025. Extreme outliers have been excluded to ensure unbiased proportions. Fund base 2024: 181,242.
When comparing the asset allocation choices of SMSFs in the different phases, the biggest difference is the allocation to listed shares. This is much higher for SMSF trustees in retirement phase – at 58.88% – compared to those in accumulation phase at 43.55%. Funds with members in both phases have a relatively high allocation to listed shares as well, at 52.49%.
There is a small difference between the asset allocations of all phases when it comes to cash and term deposits. Allocations by SMSFs in full accumulation mode are higher at 16.52%, compared to 11.50% for pension funds and 11.85% in both phrases.
Unsurprisingly, SMSFs in retirement phase have smaller allocations to illiquid assets, such as residential real property – 0.17% compared to 0.41% for accumulation phase.
As their members get older, and their minimum pension payments larger as a percentage of assets, SMSFs in retirement phase need sufficient liquid assets to meet these payments. There is also a tendency to seek out assets that pay higher yields, hence the popularity of listed shares with high-dividend yields and franking credits.
How does SMSF balance relate to asset allocation choice?
The ATO breaks down asset allocation based on SMSF balance size, which can also impact their asset allocation.
As the tables below highlight, the lower the balance of an SMSF, the higher the allocation to cash and term deposits. Funds with balances under $200,000 all have more than 39% in cash and term deposits.
When SMSF balances start to approach the $500,000 mark, their allocation to cash and term deposits reduces. But smaller funds still have a reasonable allocation to listed shares of between 19.2% and 22.9% for SMSFs with balances up to $500,000.
Interestingly, lower balance SMSFs have some of the highest allocations to cryptocurrencies, with funds under $50,000 having the highest percentage allocation to this asset class at 10.2%. This could reflect the greater acceptance of cryptocurrencies among younger people who have not yet had time to build their account balance.
| Asset Type | $1 to $50k | >$50k to $100k | >$100k to $200k | >$200k to $500k | >$500k to $1m |
|---|---|---|---|---|---|
| Listed trusts | 1.7% | 2.5% | 3.9% | 5.9% | 6.7% |
| Unlisted trusts | 2.1% | 5.1% | 7.9% | 8.0% | 7.7% |
| Insurance policy | <0.1% | <0.1% | <0.1% | <0.1% | <0.1% |
| Other managed investments | 0.9% | 1.7% | 2.7% | 4.3% | 5.1% |
| Cash and term deposits | 48.0% | 41.0% | 39.8% | 29.6% | 20.2% |
| Debt securities | 0.1% | 0.3% | 0.3% | 0.5% | 0.7% |
| Loans | 1.1% | 2.1% | 2.5% | 1.1% | 0.5% |
| Listed shares | 19.2% | 21.3% | 20.6% | 22.9% | 22.9% |
| Unlisted shares | 1.7% | 2.1% | 2.6% | 1.5% | 0.8% |
| Limited recourse borrowing arrangements | <0.1% | 0.1% | 0.4% | 9.0% | 17.9% |
| Non-residential real property | 0.3% | 0.7% | 1.4% | 4.1% | 5.7% |
| Residential real property | 0.7% | 1.6% | 2.2% | 5.2% | 7.5% |
| Collectables and personal use assets | 0.3% | 0.6% | 0.5% | 0.3% | 0.1% |
| Other assets | 10.5% | 9.5% | 7.9% | 4.4% | 2.5% |
| Cryptocurrency | 10.2% | 7.9% | 4.2% | 1.1% | 0.2% |
| Overseas shares | 2.6% | 2.7% | 2.1% | 1.4% | 1.0% |
| Overseas non-residential real property | <0.1% | 0.1% | 0.1% | <0.1% | <0.1% |
| Overseas residential real property | 0.2% | 0.4% | 0.4% | 0.2% | 0.1% |
| Overseas managed investments | 0.1% | 0.1% | 0.2% | 0.1% | 0.1% |
| Other overseas assets | 0.2% | 0.3% | 0.3% | 0.2% | 0.2% |
| Total | 100% | 100% | 100% | 100% | 100% |
| Asset Type | >$1m to $2m | >$2m to $5m | >$5m to $10m | >$10m to $20m | >$20m to $50m | >$50m |
|---|---|---|---|---|---|---|
| Listed trusts | 7.5% | 6.6% | 5.6% | 4.7% | 3.2% | 2.2% |
| Unlisted trusts | 10.0% | 12.6% | 14.8% | 16.9% | 20.6% | 18.0% |
| Insurance policy | <0.1% | <0.1% | <0.1% | <0.1% | <0.1% | 0.0% |
| Other managed investments | 6.4% | 6.8% | 6.2% | 5.7% | 4.6% | 3.7% |
| Cash and term deposits | 19.1% | 17.0% | 14.5% | 13.1% | 12.4% | 10.9% |
| Debt securities | 1.1% | 1.4% | 1.6% | 1.7% | 2.0% | 1.0% |
| Loans | 0.5% | 0.5% | 0.7% | 1.0% | 1.6% | 2.1% |
| Listed shares | 27.4% | 29.3% | 29.6% | 29.0% | 22.4% | 23.2% |
| Unlisted shares | 0.8% | 0.9% | 1.5% | 2.3% | 4.0% | 7.5% |
| Limited recourse borrowing arrangements | 8.4% | 3.7% | 3.0% | 2.7% | 4.2% | 9.0% |
| Non-residential real property | 7.9% | 10.9% | 13.1% | 13.6% | 14.3% | 10.3% |
| Residential real property | 7.0% | 5.7% | 4.1% | 3.0% | 1.8% | 2.8% |
| Collectables and personal use assets | 0.1% | <0.1% | <0.1% | 0.1% | <0.1% | 0.0% |
| Other assets | 2.3% | 2.3% | 2.6% | 2.5% | 3.6% | 4.5% |
| Cryptocurrency | 0.1% | 0.0% | 0.0% | 0.1% | <0.1% | 0.9% |
| Overseas shares | 1.2% | 1.5% | 2.0% | 2.8% | 4.0% | 2.7% |
| Overseas non-residential real property | <0.1% | <0.1% | <0.1% | <0.1% | 0.2% | 0.0% |
| Overseas residential real property | <0.1% | <0.1% | <0.1% | <0.1% | <0.1% | 0.0% |
| Overseas managed investments | 0.1% | 0.2% | 0.3% | 0.4% | 0.8% | 0.7% |
| Other overseas assets | 0.2% | 0.2% | 0.3% | 0.4% | 0.6% | 0.5% |
| Total | 100% | 100% | 100% | 100% | 100% | 100% |
Source: ATO (2022–23)
If you’d like to learn more about the most popular ETFs, Australian and international shares, managed funds and alternative investments, see the following SuperGuide articles:


Leave a comment
You must be a SuperGuide member and logged in to add a comment or question.