The number one question in retirement planning is ‘how much will I need for retirement?’. This is a complex question because of the number of unknowns we all face in retirement. How long will I live? Will the cost of living go up? What investment returns and fees should I expect on my savings?
There are also interdependencies to consider such as the way your spending, investment income and balance all interact with the means-tested Age Pension rules.
Like most aspects of modern life, technology is shooting ahead in helping us do things. It’s the same with retirement planning. In recent years there have been radical improvements in the way some software tools model retirement outcomes. They bring in techniques that are similar to the way insurance companies deal with these types of risks and uncertainty.
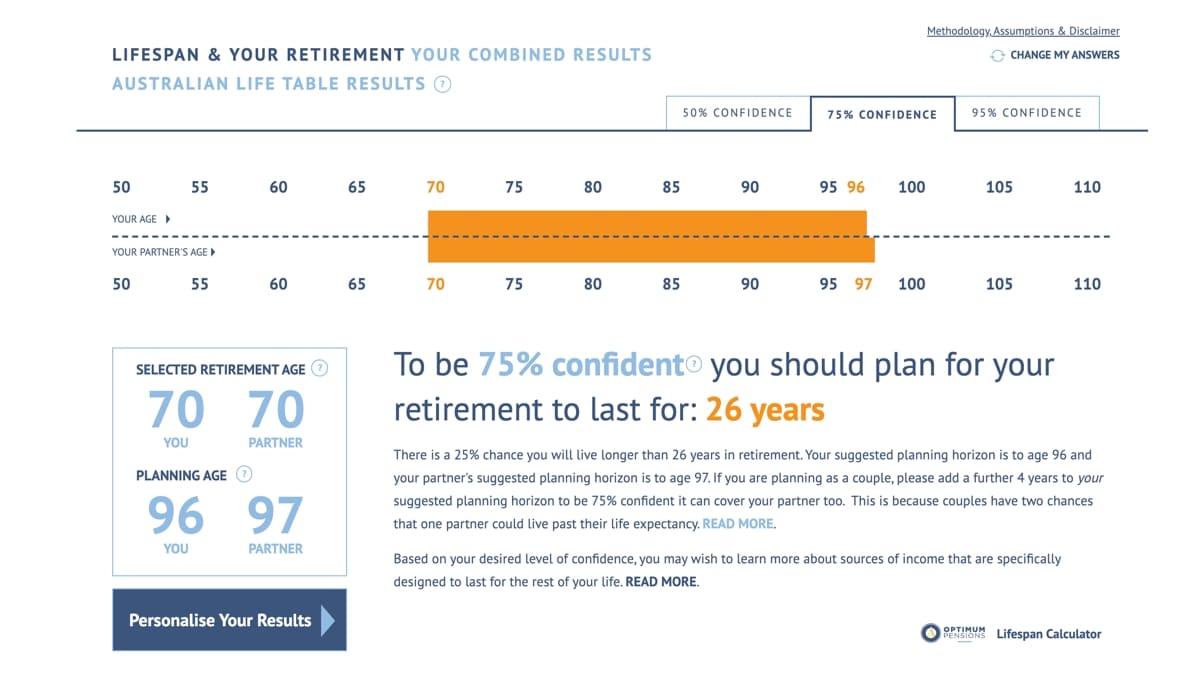
Advanced calculation tools, called ‘stochastic’ modelling, mean retirees and pre-retirees no longer need to guess how long they are going to live or what investment return assumptions to use.
Instead, experts provide access to calculation servers that consider this for you. They take into account your current investment option(s) and stress test your retirement forecast thousands of times using plausible scenarios for future market return sequences, inflation and your possible lifespan (and your spouse’s) – all weighted by the probability that each scenario may occur.
This can take into account your age, health status and the investment profile of your savings (super and non-super savings), properties and debts as well as current market conditions.
Once referred to as the ‘nastiest, hardest problem in finance’, these issues can now be dealt with.
Surveys show that top concerns of people in retirement relate to the fear of outliving their savings. Poor market performance, inflation, spending too much or living longer than expected are commonly cited concerns.
A ‘stochastic’ model calculates the probability you can achieve a particular outcome – such as enjoying a target living standard for life. Knowing this lets you make informed trade-offs. For example: “If I retire at age 65, I can be 65% confident of a comfortable retirement but if I save a bit more and work part time a few years I can be 95% confident”.
Actuaries and investment specialists have been developing these techniques for years. They build what’s called Economic Scenario Generators (ESGs) which create thousands of examples of what the global economy could do. This includes market crashes, depressions, high inflation and boom times. They do this by studying economic theory, current market conditions, historic averages and standard deviations for each asset class and correlations between them all.
This approach is also used and refined by large financial institutions globally, for example, when they must prove to regulators that they can withstand a ‘1 in 200-year event’. The theory and science have evolved considerably as computing power has improved.
Modern retirement calculators can do this for individual households too. They take all your assets, income, savings, debts and spending and map out the range of outcomes you could face under different decision sets.
Used properly, these techniques help every retiree answer their big retirement questions:
- When can I safely retire?
- How much money do I need to retire?
- What lifestyle will I be able to afford in retirement (and with what degree of confidence)?
Unpacking what drives these answers lets each person align their life decisions, such as work plans, spending levels and property decisions, with the level of confidence they need.
Examples from a leading retirement calculation server are provided below. Note this is not a free online calculator. The use of stochastic tools and knowing how to analyse and interpret the output is an expert skill. The examples have been provided by Jubilacion, a firm specialising in these calculations for Australians. (Jubilacion is the Spanish word for retirement). The software is built in partnership with specialist actuarial firm, 10E24. (10E24 is a very large number – 10 with 24 zeros after it.) The examples were provided in November 2024.
Example 1: Couple wishing to test how confident they could be to spend $90,000 per year
- Male and female, both aged 67 and both in average health
- $30,000 of personal assets (car, furniture, etc)
- No other assets, savings or income (other than the Age Pension where applicable)
| Current superannuation balance | $1,500,000 |
|---|---|
| Probability they can spend $90,000 per year for life# | 73% The Age Pension provides some support for their lifestyle later in life (gradually increasing as their super balances reduce) |
Example 2: Couple wishing to test how confident they could be to spend $55,000 per year
- Male and female, both aged 67 and both in average health
- $30,000 of personal assets (car, furniture, etc)
- No other assets, savings or income (other than the Age Pension where applicable)
| Current superannuation balance | $300,000 |
|---|---|
| Probability they can spend $55,000 per year for life# | 85% The Age Pension funds most of their retirement spending. |
Example 3: Single person wishing to test how confident they can be to spend $65,000 per year
- Female aged 67 in average health
- $20,000 of personal assets (car, furniture, etc)
- No other assets, savings or income (other than the Age Pension where applicable)
| Current superannuation balance | $1,000,000 |
|---|---|
| Probability she can spend $65,000 per year for life# | 54% The Age Pension provides gradually increasing support for her lifestyle later in life (as the super balance reduces) |
Example 4: Single person wishing to test how confident they can be to spend $45,000 per year
- Female aged 67 in average health
- $20,000 of personal assets (car, furniture, etc)
- No other assets, savings or income (other than the Age Pension where applicable)
| Current superannuation balance | $500,000 |
|---|---|
| Probability she can spend $45,000 per year for life# | 89% The Age Pension provides considerable support to fund her spending level. |
# These examples assume spending keeps pace with inflation (CPI) and continues for however long the person may live or, for couples, however long either spouse may live. For couples, their spending is assumed to reduce by 30% should one of them die.
**Important notes for all the above scenarios:
- For couples, half the super balance was assumed to be in each spouse’s name – in a typical industry fund account-based pension option.
- In any years where their incoming cashflow exceeds the above spending level, they are assumed to save the excess. In any years where their incoming cashflow is below the above spending levels they are assumed to make additional withdrawals from their retirement savings to sustain their spending.
- Where they would receive a (means-tested) Age Pension (for example, as they spend down their super) this has been allowed for in the calculations and can mean they support higher spending throughout retirement as it takes pressure off how much they need to draw from super.
- The maximum level of Age Pension is assumed to increase with price inflation, which is a cautious assumption compared to current policy.
- If market performance is favourable then they may decide to review their results and spend some of these gains.
- Please also refer to the section below “Warning: Why each person’s scenario is different to other retirees”.


Leave a comment
You must be a SuperGuide member and logged in to add a comment or question.